 Move Why This Tool Exists
Open Why This Tool Exists
Why this tool exists
Your civil society team may be using AI for different reasons. ChatGPT or Gemini 2.5 Pro may be used to analyze community data. Midjourney may be used to create campaign visuals. But who's tracking what could go wrong?
One beneficiary data leak. One biased resource allocation. One donor trust violation. Years of community trust, gone.
This tool, built specifically for CSOs, transforms AI anxiety into visual clarity. See risks. Prioritize actions. Protect your mission.
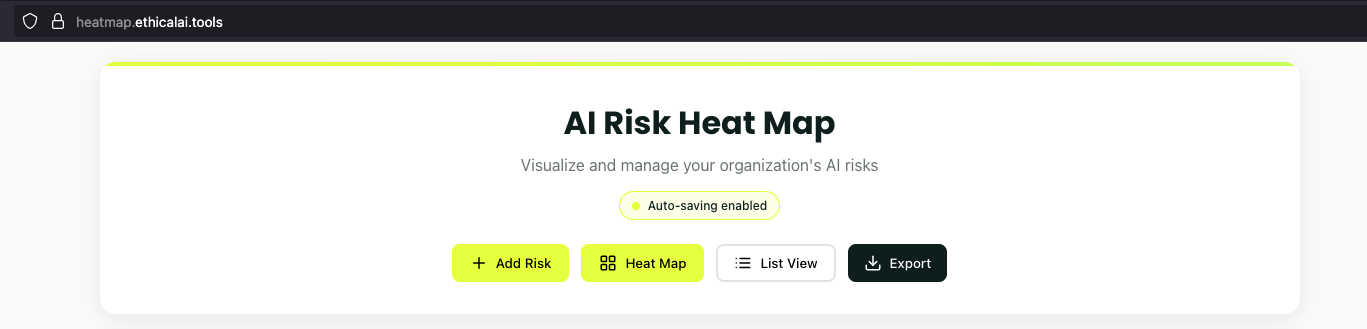
Visit our AI Risk Heatmap to get started
Why This Tool Exists
93 words
Move Reading The Heat Map
Open Reading The Heat Map
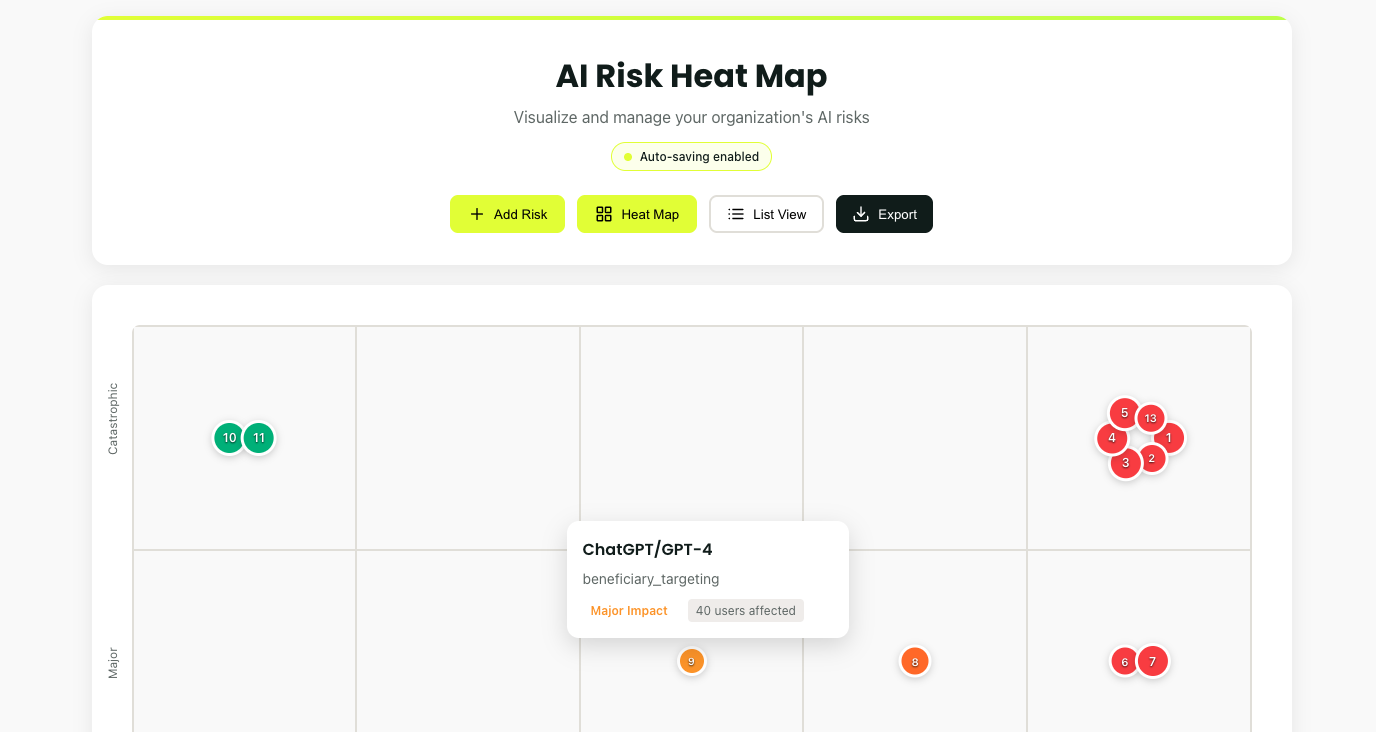
Reading the Heat Map
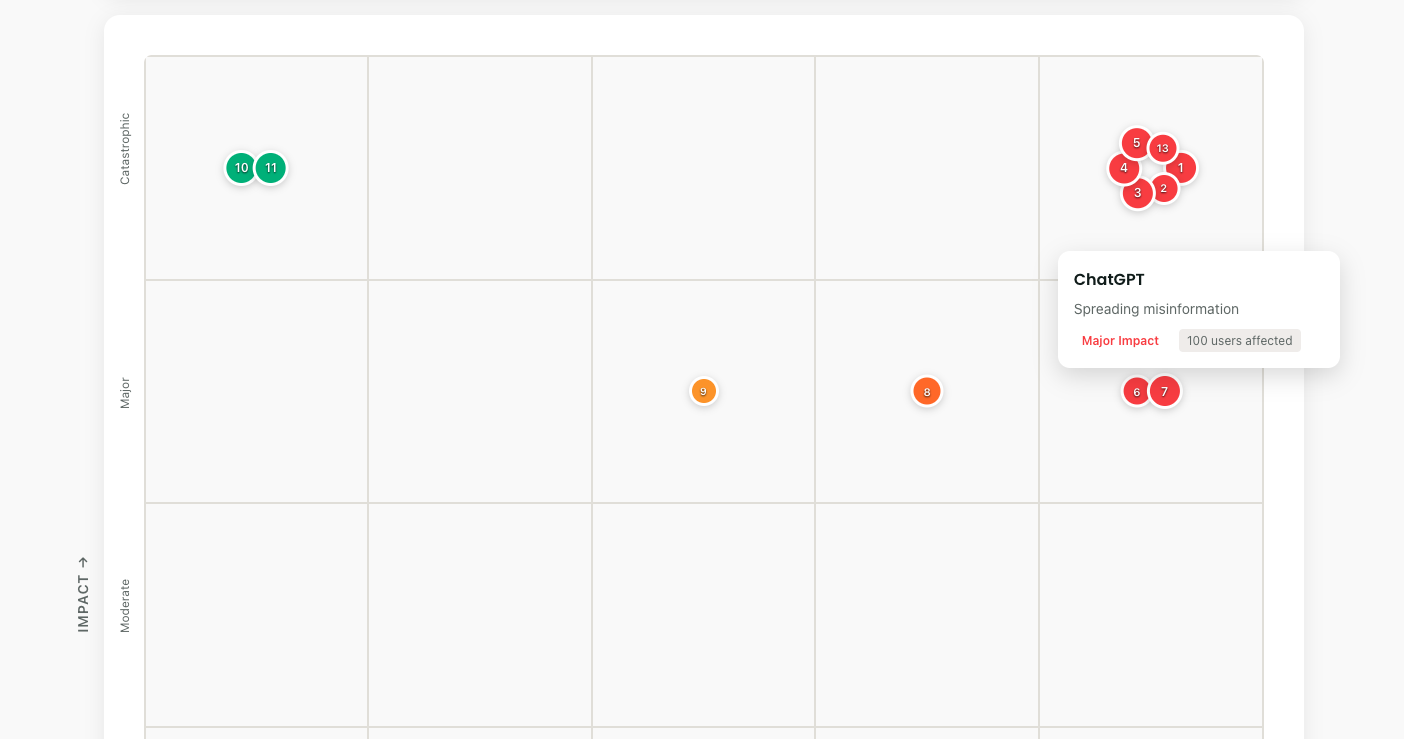
The grid is simple:
- Bottom to top: How bad would it be? (Impact)
- Left to right: How likely is it? (Likelihood)
- Dot size: How many people affected
- Colors: Green (manageable) → Red (critical)
Each risk gets a number. Risk #3 might be "Beneficiary data in ChatGPT." Risk #7 could be "Biased community needs assessment." Numbers create accountability.
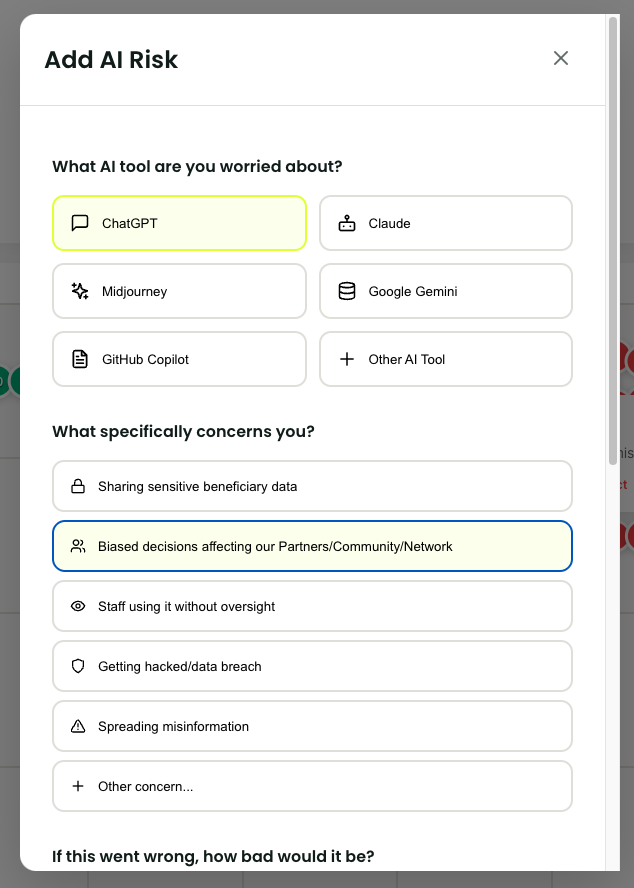
Adding Your First Risk
- Click "Add Risk"
- Pick your AI tool (or add custom)
- Select your concern
- Slide impact: "If this happened, how bad?"
- Slide likelihood: "Given our current controls, how probable?"
- Estimate affected users
- Click "Add Risk"
Done. Your first risk appears on the grid. The visual impact is immediate.
Understan
Reading The Heat Map
170 words
Move Managing Your Inventory
Open Managing Your Inventory
Reading the Heat Map
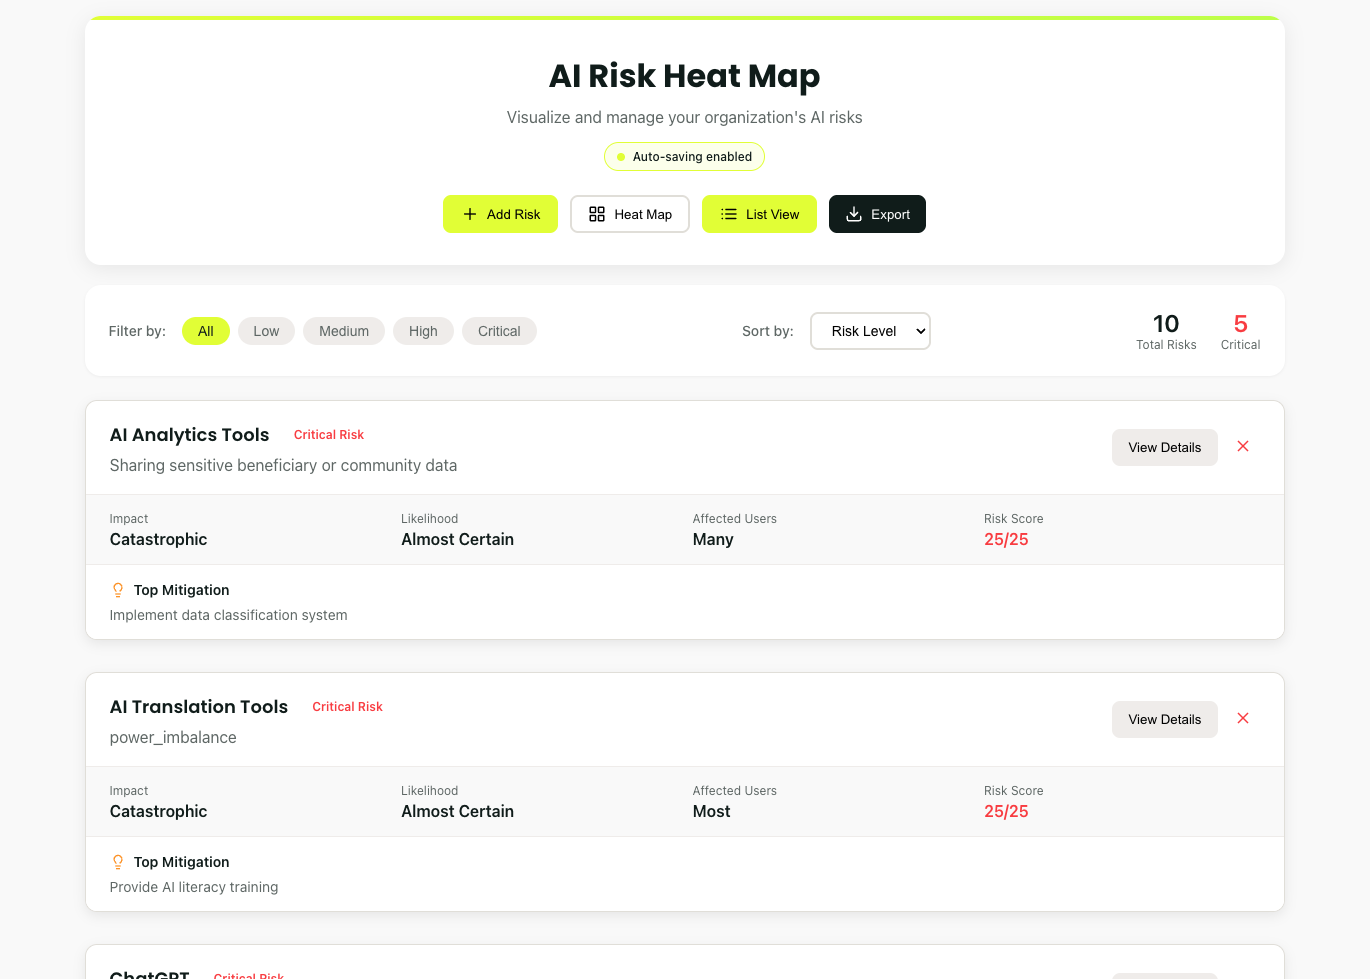
Switch to List View for detailed analysis:
- Sort by risk level
- Filter by AI tool
- Group by concern type
- Track mitigation progress
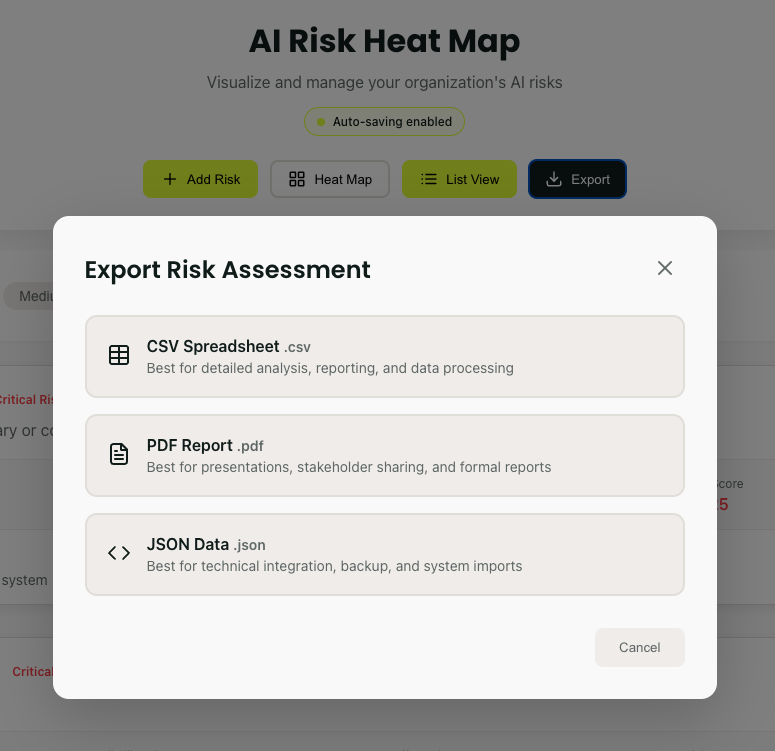
Export formats match your needs:
- PDF: Board presentations
- CSV: Detailed analysis
- JSON: System integration
Making It Routine
Weekly: Add new risks as AI usage evolves
Monthly: Review and update all risk scores
Quarterly: Export reports for leadership
Ongoing: Update after implementing controls
Set calendar reminders. Risk management requires consistency.
Managing Your Inventory
93 words
Move Pro Tips
Open Pro Tips
Pro Tips
Start focused: Assess AI tools touching beneficiary data first
Be honest: Optimistic ratings help nobody, be truthful in your assessments
Think mission-first: How could AI failure impact your beneficiaries?
Consider context: Limited IT resources affect likelihood ratings
Update regularly: Controls improve, AI risks change
Share visually: Board members may in some instances respond better to heat maps better than spreadsheets
Track progress: Celebrate when red dots turn yellow
Your First Session
Right now:
- Open the AI Risk Heatmap
- Add 3 risks (10 minutes max)
- Screenshot your Heatmap
- Share with one colleague
- Pick the reddest dot
- Implement one mitigation this week together
Pro Tips
113 words
Move Conclusion
Open Conclusion
Remember
This tool doesn't eliminate AI risks. It makes them visible, discussable, and manageable.
Your AI usage will grow. Your risks will evolve. Your heat map should too.
Start now. In 10 minutes, you'll see your AI risks clearly for the first time.
Transform uncertainty into clarity. Add your first risk today
Conclusion
59 words